Crank Astronomy
(Formerly "Dealing with Creationism in Astronomy")
Creationist Cosmology Issues
- A Changing Speed of Light? (Last Modified: November 24, 2009)
- New Redshift Interpretation (Last Modified: November 24, 2009)
- Polonium Halos (Last Modified: November 24, 2009)
- Accelerated Radioactive Decay? (Last Modified: November 24, 2009)
- Solar Claims (Last Modified: November 24, 2009)
- A Shortage of Supernova Remnants? (Last Modified: November 24, 2009)
- A Decaying Magnetic Field of the Earth (Last Modified: November 24, 2009)
- Redshift Quantization (Last Modified: March 18, 2012)
- "Relativistic" Creationist Cosmology (Last Modified: March 18, 2012)
- Anomaly Science (Last Modified: November 24, 2009)
- Development Notes (Last Modified: November 24, 2009)
Site Resources
- History & Technology (Last Modified: March 18, 2012)
- Philosophy & Religion (Last Modified: November 24, 2009)
- Classroom Resources (Last Modified: November 24, 2009)
- Presentation Slides (Last Modified: November 24, 2009)
Credits
Site Contents
© 2001-2012, W.T. Bridgman
Send comments, questions, and other inquiries to
This site is also listed at comPADRE and AstronomyCenter.org.
CSS developed with the assistance of CSScreator
![]()
A Changing Speed of Light?
Presentation Graphics
 |
Graphical analysis of time dilation when the speed of light changes. The red lines represent the paths of photon wavecrests or pulses. The blue lines represent the space-time path of emitters and receivers. Photons emitted from the blue circles propate with time along the red curves to arrive at the receiver at a later time. See the text for details in interpretation. PDF |
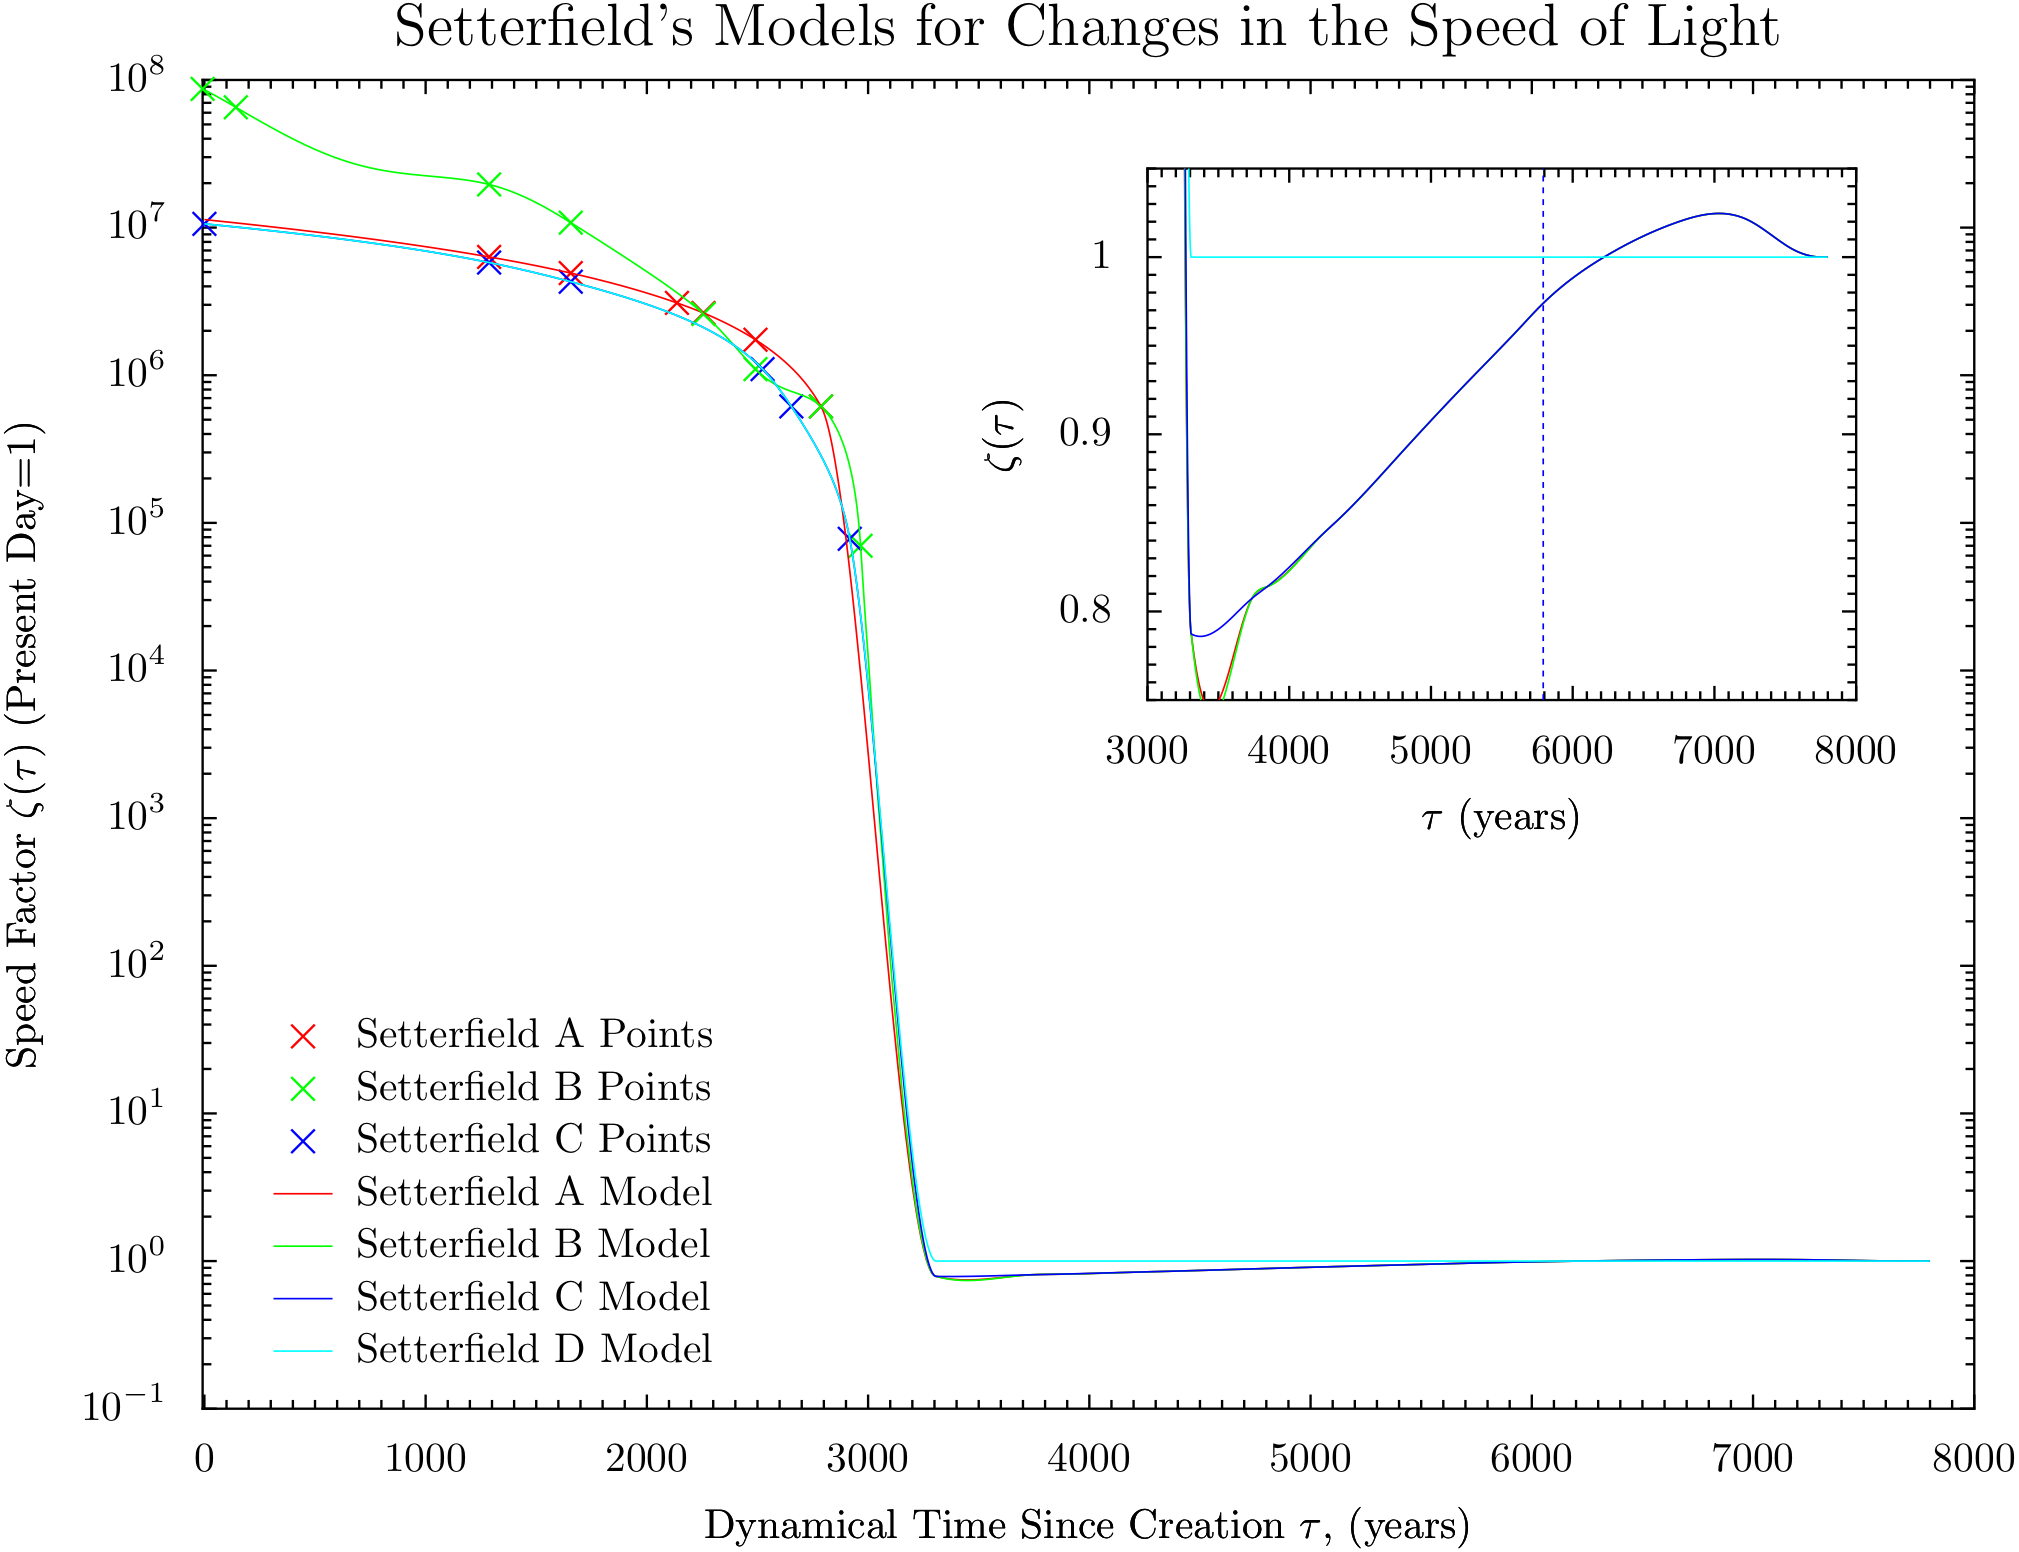 |
The speed of light as a function of time since Creation constructed from datapoints of the several models Setterfield has proposed over the years. The inset expands the scale for the recent times. PDF |
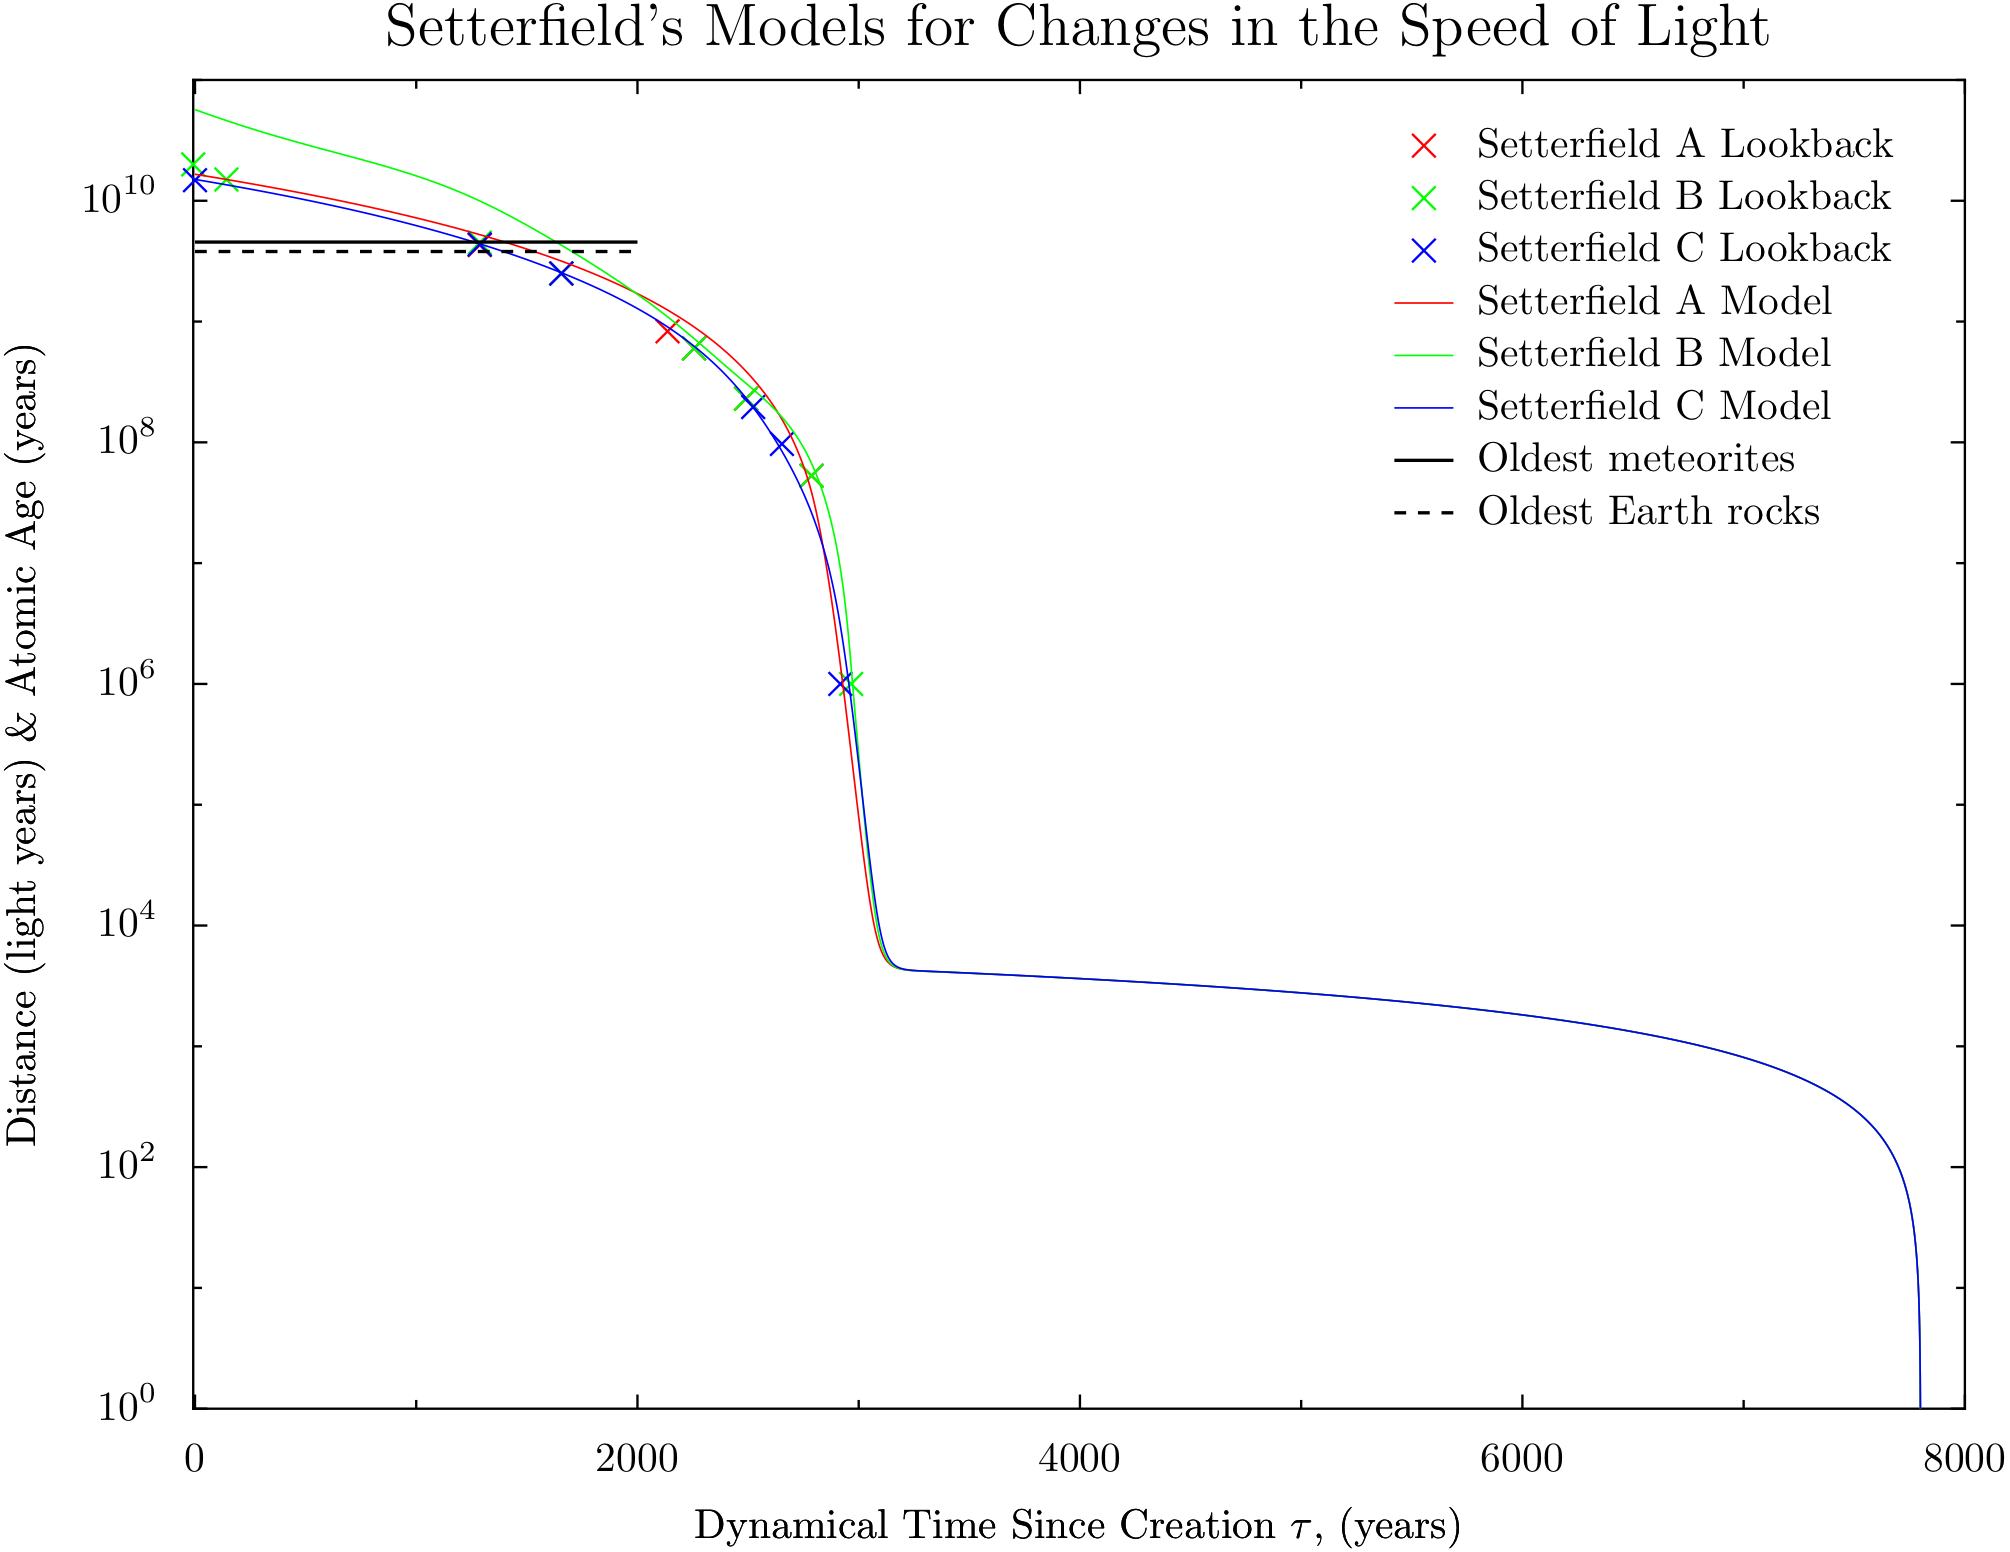 |
The integral of the Setterfield's models for the speed of light, yielding the distance and corresponding emission time for a photon to arrive today. Setterfield D is missing from this plot due to interpolation errors. The horizontal black lines mark the time of the Earth's creation from isotope dating. PDF |
 |
The speed of light as a function of time since Creation constructed from datapoints of the several models Setterfield has proposed over the years. This includes a plot of Setterfield E, with Setterfield's constant 'k' assigned so that the time integral since creation will correspond to the age of the Universe, for this example, 14 billion years. The inset expands the scale for the recent times. PDF |
 |
The integral of the Setterfield's models for the speed of light, yielding the distance and corresponding emission time for a photon to arrive today. This plot includes the normalized form of Setterfield E. Setterfield D is missing from this plot due to interpolation errors. The horizontal black lines mark the time of the Earth's creation from isotope dating. PDF |
Last Modified: Tue Nov 24 23:41:15 2009