Crank Astronomy
(Formerly "Dealing with Creationism in Astronomy")
Creationist Cosmology Issues
- A Changing Speed of Light? (Last Modified: November 24, 2009)
- New Redshift Interpretation (Last Modified: November 24, 2009)
- Polonium Halos (Last Modified: November 24, 2009)
- Accelerated Radioactive Decay? (Last Modified: November 24, 2009)
- Solar Claims (Last Modified: November 24, 2009)
- A Shortage of Supernova Remnants? (Last Modified: November 24, 2009)
- A Decaying Magnetic Field of the Earth (Last Modified: November 24, 2009)
- Redshift Quantization (Last Modified: March 18, 2012)
- "Relativistic" Creationist Cosmology (Last Modified: March 18, 2012)
- Anomaly Science (Last Modified: November 24, 2009)
- Development Notes (Last Modified: November 24, 2009)
Site Resources
- History & Technology (Last Modified: March 18, 2012)
- Philosophy & Religion (Last Modified: November 24, 2009)
- Classroom Resources (Last Modified: November 24, 2009)
- Presentation Slides (Last Modified: November 24, 2009)
Credits
Site Contents
© 2001-2012, W.T. Bridgman
Send comments, questions, and other inquiries to
This site is also listed at comPADRE and AstronomyCenter.org.
CSS developed with the assistance of CSScreator
![]()
A Shortage of Supernova Remnants?
See TalkOrigins.org: Supernovae, Supernova Remnants and Young Earth Creationism FAQ
Here's a test run of a small Python program that can generate simple sky maps using a specified galaxy distribution, supernova rate, and remnant expansion model. Two maps are generated - one with points identifying each SN remnant, the other builds a circular remnant centered on the point with some thickness and transparency. Intensity is weighted by age and distance. I suspect these details could be seriously improved. Effects of ISM, other stars, collisions with other remnants, etc. are not currently included.
Here's sample output from a run:
A list (1.9MB, TEXT) of simulated supernova events. This simulation is run with a mean time between events of 100 years. For each event, it includes positions, ages, and apparent size. There is also a note as to whether the light of the event has had time to reach the observer at the position of the Earth.
A position map (7200x3600, 452KB, TIFF). This is a Platte-Carre projection of the sky in galactic coordinates (longitude is horizontal, latitude is vertical). The galactic plane runs horizontally across the center of the map. Each point represents the sky location of a supernova event from the list above. With the high resolution, you may need to zoom into the image pretty far to see anything.
A sky map data file(7200x3600, 98.9MB, FITS). Below are two image versions of the map. The upper version is scaled linearly in intensity, while the lower version has a logarithmic scaling which brings out the much fainter remnants.
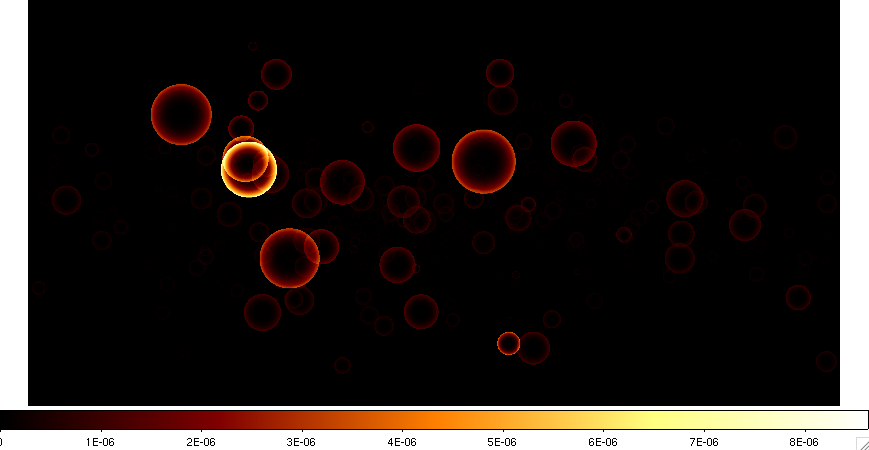
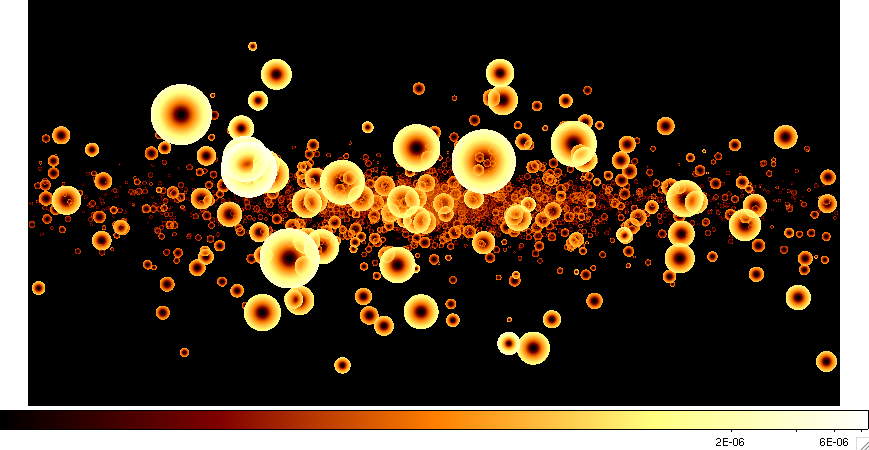
This map builds a simple circular shell around each event location, the radius and intensity based on a simple expansion model. This represents the size and relative itensity of the supernova remnant as it would appear to an observer about 2/3rds of the distance from the center to the edge of the galaxy model in the simulation. Currently, projection effects which would be prominent at extreme galactic latitudes are not included. Even in this currently idealized situation, one can see how difficult it can be to identify all the remnants. This map is readable in programs like DS9.
This program is still under development. Some of the improvements planned are:
- A model interstellar medium which would obscure more remnants in the galacitic plane.
- Intervening stars.
- A better SNR expansion model for time, radius, temperature, and opacity.
- A distribution of supernova event intensities (currently they are uniform).
- An SNR expansion that allows more realistic turbulent expansion instead of the uniform perfect spheres of the current model.
- Include projection effects in the map.
I've also built some preliminary code for a full 3-D animation of the map generation.
Student Exercise Idea: Generate a map and provide the data file that does not include the input events of the simulation. See how many remnants the students can actually identify. Compare that to the total number (nearly 10,000) actually in the map.
Last Modified: Tue Nov 24 23:41:17 2009